Saturday, November 29, 2014

Configure Firewall In Iptables For Hadoop Cluster

Security Problem

As for HDFS, which is configured along with Hadoop, the 'dfs.namenode.http-address' parameter in hdfs-site.xml specifies an URL which is used to monitoring HDFS:
  <property>
    <name>dfs.nameservices</name>
    <value>ns1</value>
  </property>
 
  <property>
    <name>dfs.ha.namenodes.ns1</name>
    <value>nn1,nn2</value>
  </property>
 
  <property>
    <name>dfs.namenode.rpc-address.ns1.nn1</name>
    <value>k1201.hide.cn:8020</value>
  </property>

  <property>
    <name>dfs.namenode.rpc-address.ns1.nn2</name>
    <value>k1202.hide.cn:8020</value>
  </property>

  <property>
    <name>dfs.namenode.http-address.ns1.nn1</name>
    <value>k1201.hide.cn:50070</value>
  </property>

  <property>
    <name>dfs.namenode.http-address.ns1.nn2</name>
    <value>k1202.hide.cn:50070</value>
  </property>

After HDFS service is on, the HDFS monitoring webpage just looks like below:


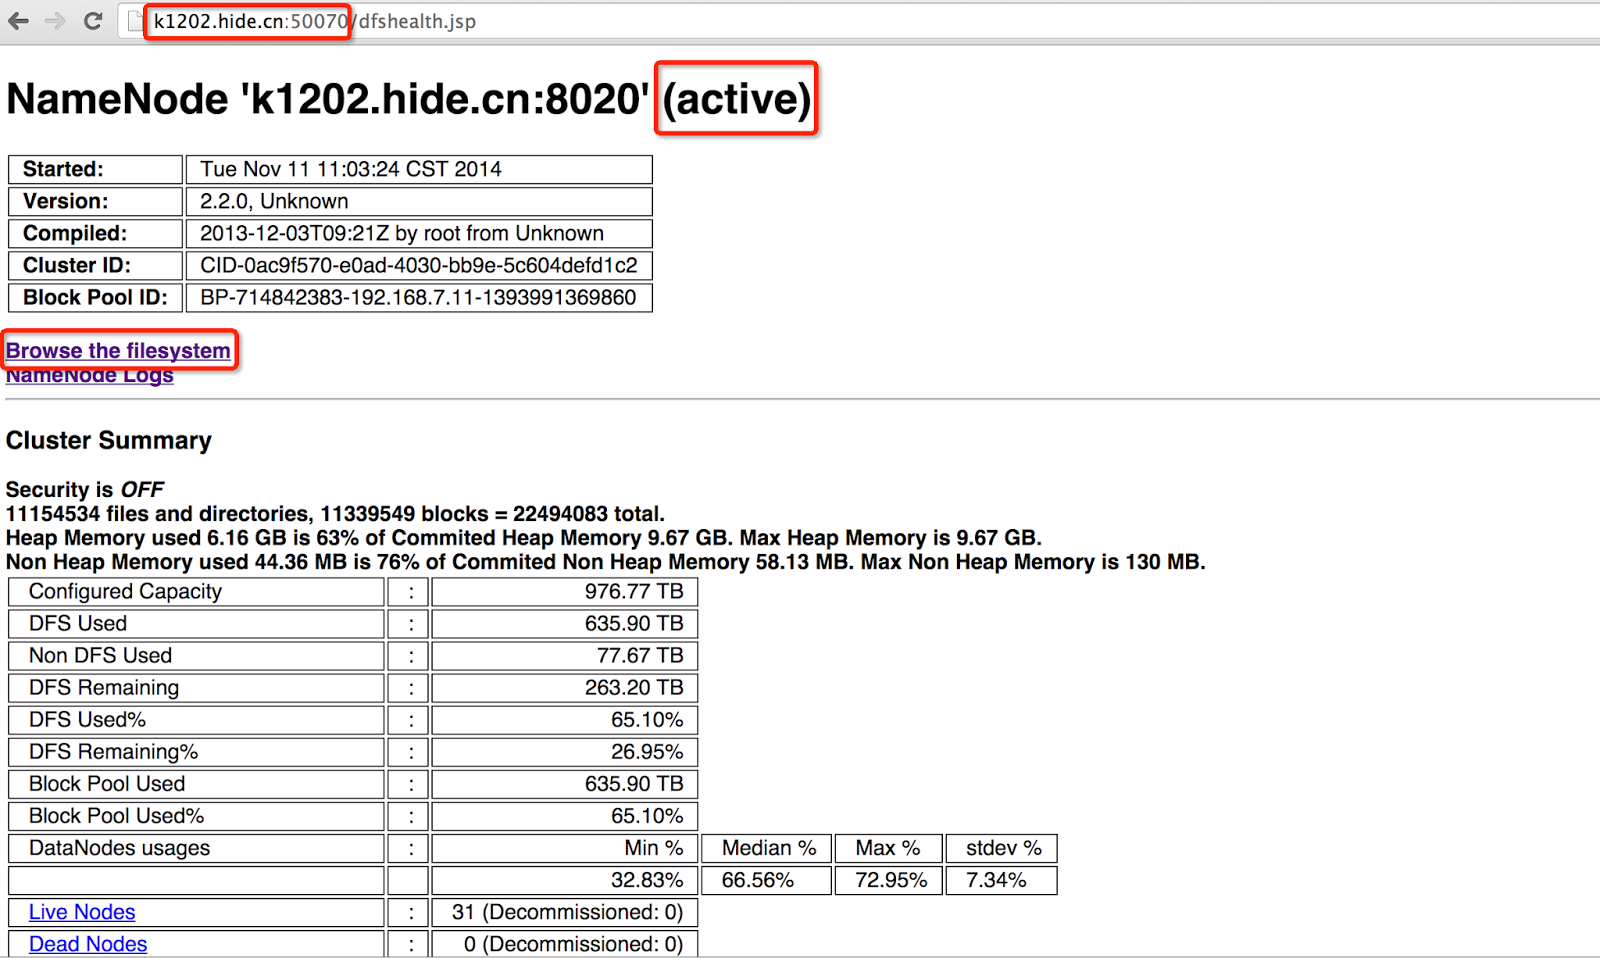
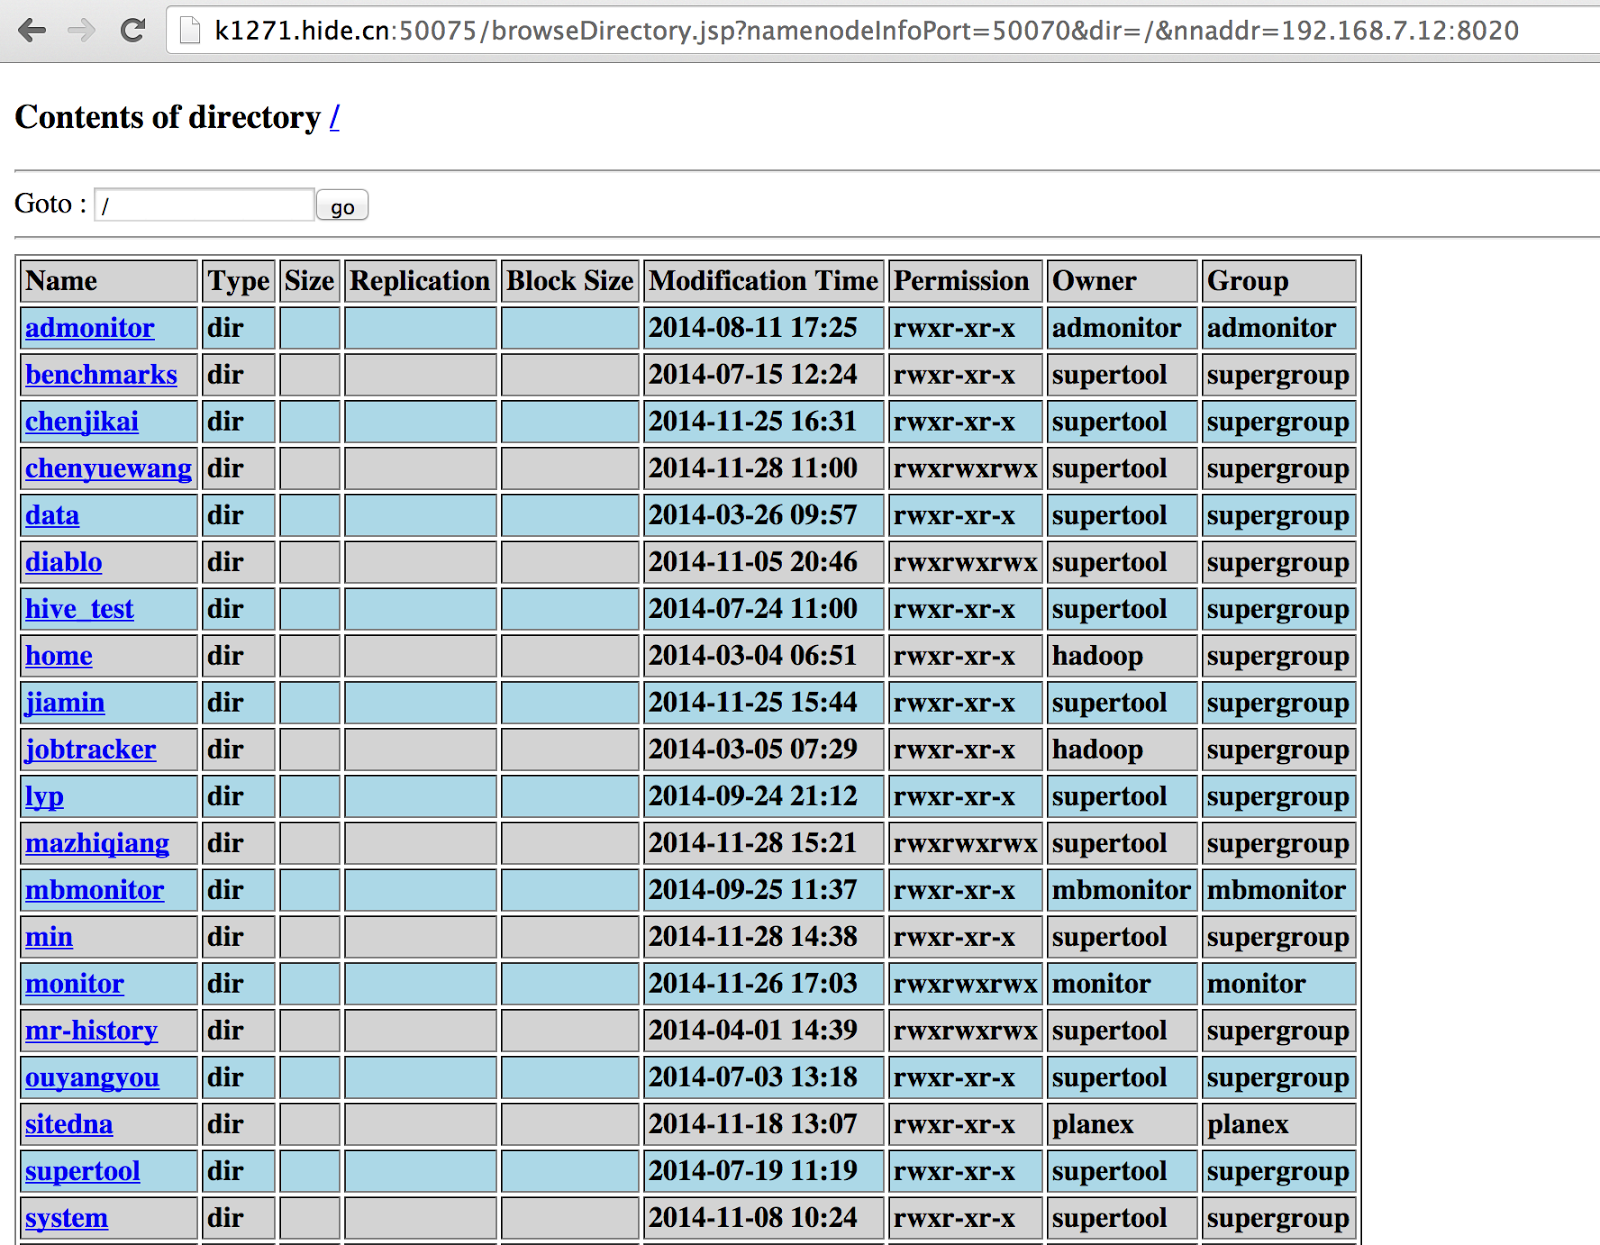
If clicking 'Browse the filesystem' , we could explore and download ALL DATA stored in HDFS, which is virtually not what we want.


Configuration For Iptables

Firstly, erase all current iptables rules should iptbales is on. The reason that we have to explicitly state INPUT, FORWARD, OUTPUT to ACCEPT is that no packet can pass into that machine after we execute flush if one of them is set default to DROP.
/sbin/iptables --policy INPUT ACCEPT
/sbin/iptables --policy FORWARD ACCEPT
/sbin/iptables --policy OUTPUT ACCEPT
/sbin/iptables --flush

The final target of our settings in iptables is to block all kinds of TCP connections (apart from SSH) from external IP address to nodes in Hadoop cluster, whereas the reverse direction is allowed. In the meantime, connections among nodes in Hadoop cluster should not be restricted. Here's the command to achieve this:
iptables -L -v -n
iptables -A INPUT -s 192.168.0.0/255.255.0.0 -j ACCEPT
iptables -A OUTPUT -d 192.168.0.0/255.255.0.0 -j ACCEPT
iptables -A INPUT -s 127.0.0.1 -j ACCEPT
iptables -A OUTPUT -d 127.0.0.1 -j ACCEPT
iptables -A INPUT -p tcp --dport ssh -j ACCEPT
iptables -A OUTPUT -p tcp --sport ssh -j ACCEPT
iptables -A INPUT -m state --state ESTABLISHED,RELATED,UNTRACKED -j ACCEPT
iptables --policy INPUT DROP
iptables --policy OUTPUT ACCEPT

  1. `-L` will show current rules set in iptables, and will start iptables provided the service is off. `-v` will show detailed packet and byte info. `-n` will disable all DNS resolution in the output results.
  2. The next two lines of rule will allow any packet that are from node with LAN IP 192.168.*.* going in and out.
  3. The fourth and fifth line of rule accepts any packet that are from localhost/127.0.0.1.
  4. The sixth and seventh line of rule will accept ssh connection from any source, namely LAN IP and external IP.
  5. The eighth line of rule will allow all TCP INPUT whose state is ESTABLISHED, RELATED or UNTRACKED, purpose of which is allowing all Hadoop nodes to start TCP connection with external IP and the external one can send back packets successfully.
  6. The last two lines of rule set the default policy of INPUT and OUTPUT to DROP, so as to block anything if a packet is not matched by the above rules.

After setting, run the following command again to double check whether rules have been configured successfully or not.
$ iptables -L -v -n

Chain INPUT (policy DROP 199 packets, 66712 bytes)
 pkts bytes target     prot opt in     out     source               destination         
4243K 3906M ACCEPT     all  --  *      *       192.168.0.0/16       0.0.0.0/0           
  409 47240 ACCEPT     all  --  *      *       127.0.0.1            0.0.0.0/0
    0     0 ACCEPT     tcp  --  *      *       0.0.0.0/0            0.0.0.0/0           tcp dpt:22
  119 19947 ACCEPT     all  --  *      *       0.0.0.0/0            0.0.0.0/0           state RELATED,ESTABLISHED,UNTRACKED 

Chain FORWARD (policy ACCEPT 0 packets, 0 bytes)
 pkts bytes target     prot opt in     out     source               destination         

Chain OUTPUT (policy ACCEPT 131 packets, 9395 bytes)
 pkts bytes target     prot opt in     out     source               destination         
1617K 6553M ACCEPT     all  --  *      *       0.0.0.0/0            192.168.0.0/16      
  409 47240 ACCEPT     all  --  *      *       0.0.0.0/0            127.0.0.1
    0     0 ACCEPT     tcp  --  *      *       0.0.0.0/0            0.0.0.0/0           tcp spt:22

If all is correct, remember to make it persistent via the following command. If not, iptables will reload the persistent iptables-config file, which may be a stale version of iptables rules, at the time the machine restarts.
/sbin/iptables-save > /etc/sysconfig/iptables

From my own Mac, which is external IP of course, run the following command in order to check whether the specific port in that Hadoop node is available or not.
telnet 644v(1/2/3).hide.cn 22                 #Success!
telnet 644v(1/2/).hide.cn 50070               #Fail
telnet 644v(1/2/3).hide.cn 50075              #Fail
telnet 644v(1/2/).hide.cn 9000                #Fail

# Or in a more elegant way:
$ nmap -sT -sV -Pn 644v*.hide.cn
Starting Nmap 6.47 ( http://nmap.org ) at 2014-12-01 10:40 HKT
Nmap scan report for *.hide.cn (xx.xx.xx.xx)
Host is up (0.017s latency).
rDNS record for xx.xx.xx.xx: undefine.inidc.com.cn
Not shown: 999 filtered ports
PORT   STATE SERVICE VERSION
22/tcp open  ssh     OpenSSH 4.3 (protocol 2.0)

In the above, 50070 is set by 'dfs.namenode.http-address', 50075 is set by 'dfs.datanode.http.address', and 9000 is set by 'dfs.namenode.rpc-address'. All these parameters are configured in hdfs-site.xml.

After configuring, we SSH to a node in Hadoop cluster, executing `hadoop jar share/hadoop/mapreduce/hadoop-mapreduce-examples-2.2.0.jar wordcount input output` and it turns out successful.

Proxy Setting For Hadoop Cluster

After starting iptables, we are not able to access HDFS and YARN monitoring webpages from external IP anymore. The easiest way to solve this problem elegantly is to set dynamic port forwarding via `ssh`.

Only two commands are required to invoke on our own PC:
netstat -an | grep 7001
ssh -D 7001 supertool@644v3.hide.cn

The purpose of first command is to check whether port 7001 has been occupied by other programs. If not, the second command will create a socks tunnel from our own PC to the node in Hadoop cluster via ssh. All packets sending to port 7001 in our PC will forward to that node in Hadoop cluster.

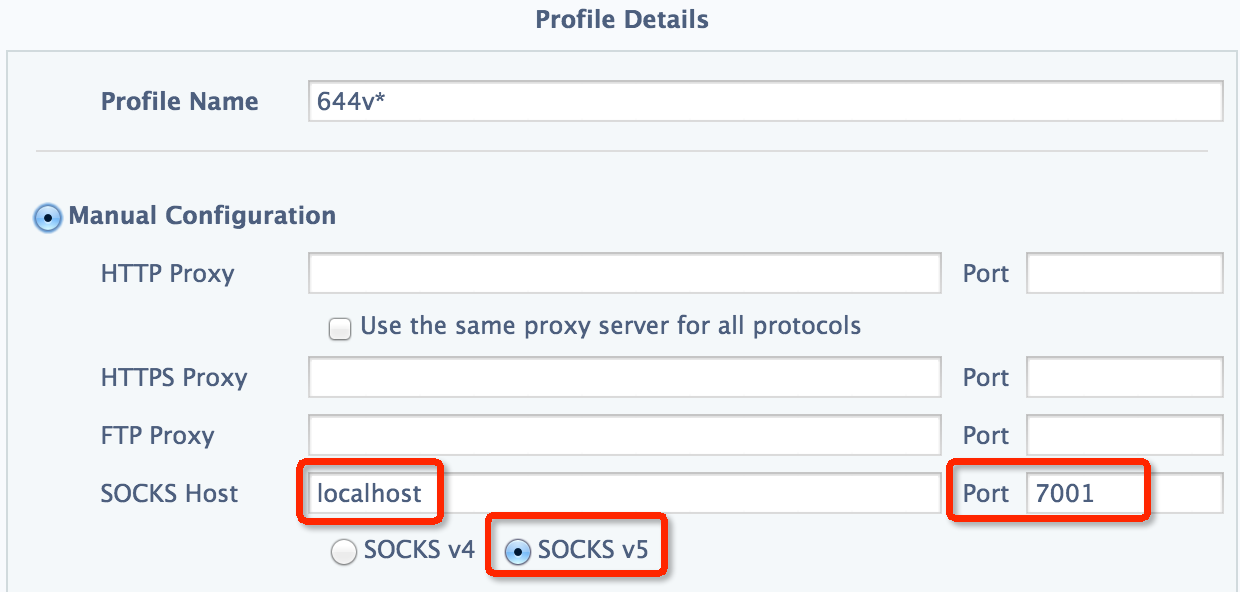
As for chrome, we could configure it in SwitchySharp, which is quite simple and handy, as below:


However, since the node in Hadoop cluster is not accessible to external IP, we are not capable of surfing the Internet like youtube or twitter as well as monitoring on the HDFS or YARN webpage simultaneously provided configuration of proxy is set in the above manner.

Consequently, I write a custom PAC file which looks like below:
function FindProxyForURL(url,host)
{   
   if(host.indexOf("hide") > -1)
       return "SOCKS5 127.0.0.1:7001";
   return "DIRECT";
}

In which, "hide" is the keyword of our host for HDFS and YARN monitoring webpage. If "hide" appears in the host name, use the SOCKS5 proxy, and direct connection is applied otherwise.

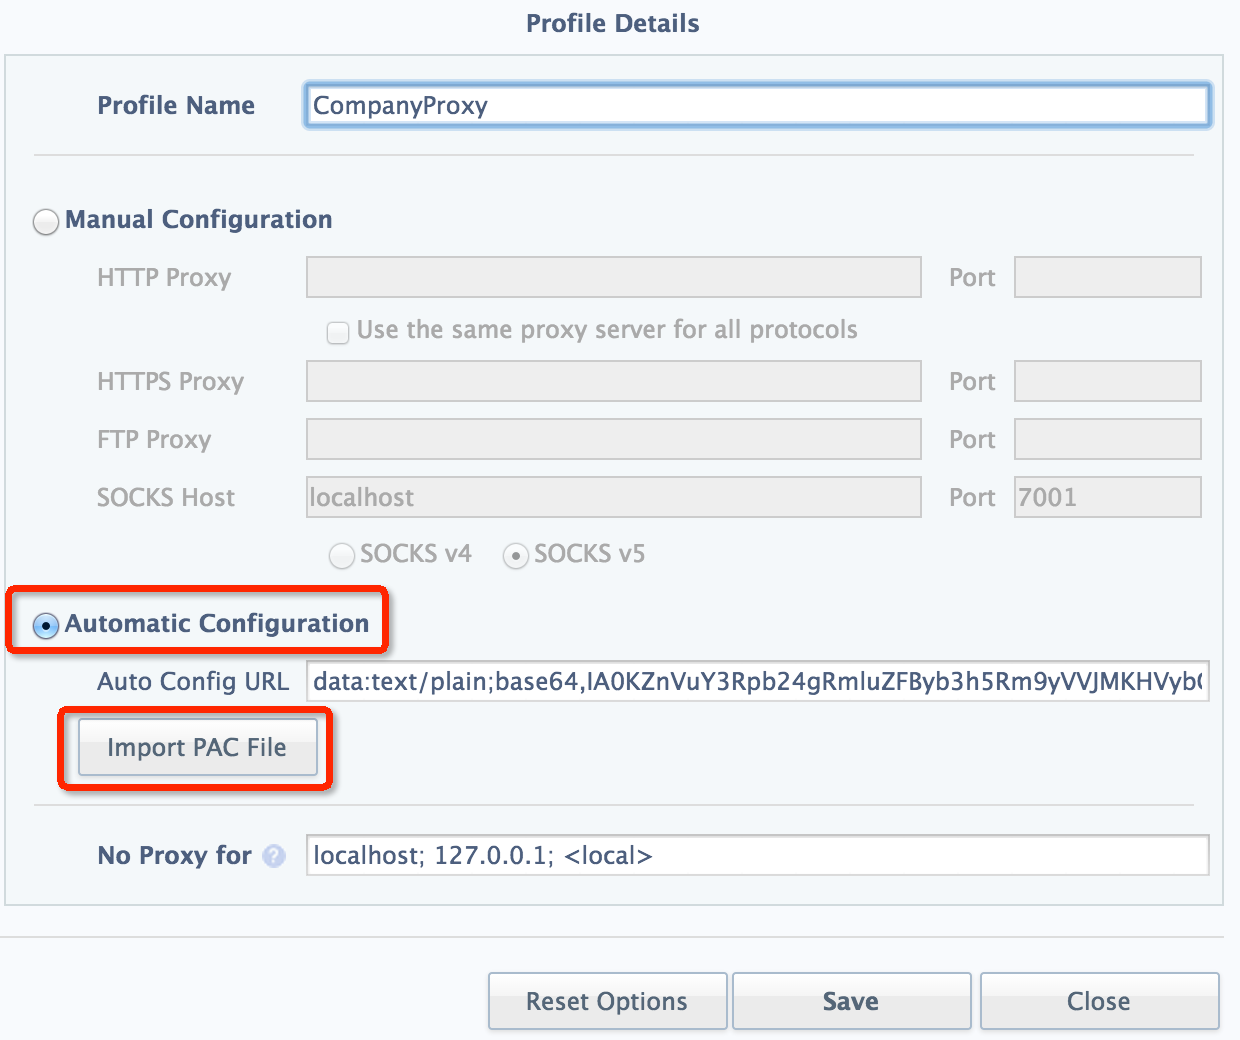
Finally, import this PAC file in SwitchySharp:


If this proxy is set on another node rather than localhost, we have to add '-g' parameter, which is well-explained in document: "Allows remote hosts to connect to local forwarded ports", to accept external IP other than mere localhost.
ssh -g -D 7001 supertool@644v3.hide.cn


References:
  1. the-beginners-guide-to-iptables-the-linux-firewall
  2. 25 Most Frequently Used Linux IPTables Rules Examples
  3. Configuring iptables - HortonWorks
  4. SSH Forward - IBM
  5. SSH Port Forwarding
  6. pac-functions


© 2014-2017 jason4zhu.blogspot.com All Rights Reserved 
If transfering, please annotate the origin: Jason4Zhu

Sunday, November 23, 2014

~/.profile is not being loaded automatically when opening a new terminal in Mac OS X

I intend to put some environment variables in my '~/.profile' hoping to load them automatically every time I open a new terminal in Mac OS X, but it doesn't work by checking environment variables via `env` command.

The manual page shipping with Mac OS X explains this issue clearly:
it looks for ~/.bash_profile, ~/.bash_login, and ~/.profile, in that order,
and reads and executes commands from the first one that exists and is readable.

I found that '~/.bash_profile' exists, hence the terminal will not go on finding and loading my '~/.profile'. It's recommended that we append the following code in '~/.bash_profile':
if [ -f ~/.profile ]; then
    source ~/.profile
fi


© 2014-2017 jason4zhu.blogspot.com All Rights Reserved 
If transfering, please annotate the origin: Jason4Zhu

Saturday, November 22, 2014

An Explanation On Too Many Socket Connections In CLOSE_WAIT State When Mapreduce Applications Are Running In Hadoop

Occasionally, we found that there are too many TCP connections with state CLOSE_WAIT on DataNode when our daily MapReduce tasks are running in Hadoop. At some time, the amount can be approximately up to 20000.
/usr/sbin/lsof -i tcp | grep -E 'CLOSE_WAIT|COMMAND'


Firstly, we should be familiar with the process of TCP three-way handshake as well as four-way termination, which is well illustrated in the following graph.


Let's explain more detail on four-way termination process which is related to our problem.

When data transfer between client and server is done, whoever calls close method first, it, as the 'active' end, will send a 'FIN M' to the other one, and transit to FIN_WAIT_1 state.

The 'passive' end sends a 'ACK M+1', after receiving which the 'active' end goes into state 'FIN_WAIT_2', back to the 'active' one and transits into state CLOSE_WAIT right after it receives the 'FIN M' signal.

When the 'passive' end invokes close method and sends 'FIN N' to the 'active' one again, the 'active' one transits to 'TIME_WAIT' state. After waiting for tcp_time_wait_interval amount of time to ensure that there are no leftover segments, the 'active' end send 'ACK N+1' back to the 'passive' one, and a TCP connection terminates.

After getting some general understanding of TCP four-way termination, I did an experiment to simulate the above process by reading file from HDFS. The code snippet is as below:
import org.apache.hadoop.conf.Configuration;
import org.apache.hadoop.fs.FileSystem;
import org.apache.hadoop.fs.Path;
import org.apache.hadoop.io.IOUtils;

import java.io.BufferedReader;
import java.io.IOException;
import java.io.InputStreamReader;

/**
 * Created by jasonzhu on 20/11/14.
 */
public class HdfsCloseWait {
    public static void main(String[] args) throws IOException, InterruptedException {
        Path pt=new Path("hdfs://ns1/user/supertool/zhudi/input/blk_1073752163");
        FileSystem fs = FileSystem.get(new Configuration());
        BufferedReader br=new BufferedReader(new InputStreamReader(fs.open(pt)));
        String line;
        line=br.readLine();
        System.out.println("sleep at phase 1");
        Thread.sleep(1*30*1000);
        while (line != null) {
            System.out.println(line);
            line = br.readLine();

        }
        System.out.println("sleep at phase 2");
        Thread.sleep(1*30*1000);
        IOUtils.closeStream(br);
        fs.close();
        System.out.println("sleep at phase 3");
        Thread.sleep(10*30*1000);
        System.out.println("done=["+pt.toString()+"]");
    }
}

Run it with command:
hadoop jar com.judking.mr-1.0-SNAPSHOT-jar-with-dependencies.jar HdfsCloseWait

At the same time, monitor TCP connection for this java process on every phase, which is printed out in my code, via command:
#get the PID of this java process
/usr/java/jdk1.7.0_11/bin/jps

#either of the following command will work for monitoring TCP connection
/usr/sbin/lsof -i tcp | grep PID
netstat -anp | grep PID

Result:
Phase TCP connection state
phase 1 ESTABLISHED
phase 2 CLOSE_WAIT
phase 3 CLOSE_WAIT

The result shows that it will transit to CLOSE_WAIT state right after it has read to EOF. In this scenario, the HDFS server is the 'active' end.

It will stay at CLOSE_WAIT state no matter we call close() method or not. However, the TCP connection in CLOSE_WAIT will disappear after some time, which is before the java process dies, whereas it will last to the time the java process dies if we do not call close() method after reading the file.

Thus, it is just a normal TCP connection no matter how many CLOSE_WAIT TCP connections there are provided we remember to call close() method every time.


© 2014-2017 jason4zhu.blogspot.com All Rights Reserved 
If transfering, please annotate the origin: Jason4Zhu

A Record On The Process Of Adding Memory Bank To Datanode In Hadoop

There was an emergency requirement that we need to increase the memory of DataNodes in our Hadoop cluster. Here's the detailed process, in which, two phases are involved. Namely, operation on DataNode and operation on YARN.

At the very beginning,  we should backup configuration file, which is in $HADOOP_HOME/etc/hadoop/*, in git.

At the same time, we should backup the runtime configuration of JobHistory server provided HistoryServer is enabled. This is well-explained in my another post: Dig Into JobHistory Server Of MapReduce In Hadoop2. The runtime configuration can be found at the monitoring webpage of JobHistory server:


Then, we should revise 'yarn.nodemanager.resource.memory-mb' argument in $HADOOP_HOME/etc/hadoop/yarn-site.xml applying to our new memory capacity and synchronizing it to all nodes in Hadoop cluster. Since DataNode doesn't restart for now, the change of configuration makes no effect at current time.
su hadoop

#all DataNodes
for i in $(cat $HADOOP_HOME/etc/hadoop/slaves | grep -v "#")
do
 echo '';
 echo $i;
 rsync -r --delete $HADOOP_HOME/etc/hadoop/ hadoop@$i:/home/workspace/hadoop/etc/hadoop/;
done

#NameNode
rsync -r --delete $HADOOP_HOME/etc/hadoop/ hadoop@k1202.hide.cn:/home/workspace/hadoop/etc/hadoop/;

For every DataNode:

1.1. Backup information about current block devices

We need to do so in case of disk info loses after we restart DataNode. Execute the following command and paste the output into '/etc/rc.local'.
--mount.sh--
n=1 ; for i in a b c d e f g h i j k l ; do a=`/sbin/blkid -s UUID | grep ^/dev/sd$i | awk '{print $2}'` ; echo mount $a /home/data$n ; n=`echo $n+1|bc` ; done

> bash mount.sh
mount UUID="09c42017-9308-45c3-9509-e77a2e99c732" /home/data1
mount UUID="72461da2-b0c0-432a-9b65-0ac5bc5bc69a" /home/data2
mount UUID="6d447f43-b2db-4f69-a3b2-a4f69f2544ea" /home/data3
mount UUID="37ca4fb8-377c-493d-9a4c-825f1500ae52" /home/data4
mount UUID="53334c93-13ff-41f5-8688-07023bd6f11a" /home/data5
mount UUID="10fa31f7-9c29-4190-8ecd-ec893d59634c" /home/data6
mount UUID="fe28b8dd-ff3b-49d9-87c6-6eee9f389966" /home/data7
mount UUID="5201d24b-9310-4cff-b3ad-5b09e47780a5" /home/data8
mount UUID="d3b85455-8b94-4817-b43e-69481f9c13c4" /home/data9
mount UUID="6f2630f1-7cfe-4cac-b52d-557f46779539" /home/data10
mount UUID="bafc742d-1477-439a-ade4-29711c5db840" /home/data11
mount UUID="bf6e36d8-1410-4547-853c-f541c9a07e52" /home/data12

1.2. Stop DataNode service

$HADOOP_HOME/sbin/hadoop-daemon.sh stop datanode

1.3. Stop NodeManager service

$HADOOP_HOME/sbin/yarn-daemon.sh stop nodemanager

1.4. Double-check on Java process

Check whether DataNode and NodeManager process have been stopped. If not, invoke `kill -9 PID` to stop the process forcibly.
ps aux | grep java

1.5. Shutdown DataNode

After issuing the following command to shutdown DataNode, we wait for the signal from our colleagues when they finish the installation of memory bank.
su root
/sbin/init 0

1.6. Check and operation on Linux when DataNode restarts again

After machine restarts again, check on the most significant part: memory, to be assure that it has been increased as expected.
free -g

Next, check on disk mount info. If not consistent with the backup one stated in 1.1., execute the backup command to reload it.
df

Open firewall (iptables), whose guide is in another of my post.

1.7. Start DataNode service

$HADOOP_HOME/sbin/hadoop-daemon.sh start datanode

1.8. Start NodeManager service

$HADOOP_HOME/sbin/yarn-daemon.sh start nodemanager

1.9. Check health condition

Check whether the process of DataNode and NodeManager exists:
ps aux | grep java

If does, look through $HADOOP_HOME/logs/*.log to make sure there is no vital ERROR in it.

That's all for operation on DataNode part. We need to repeat from 1.1. to 1.9. for every DataNode. Since our HDFS replication is set to 3, the maximum of failed DataNode that can be tolerated is 2. This should be kept in mind.

In the next section, it is the operation on YARN.

2.1. Double-check on all DataNodes

Look through all the DataNodes listed in YARN monitoring webpage, which is configured in yarn-site.xml: yarn.resourcemanager.webapp.address, to be assure that they all works normally.


2.2. Start/Stop service

Ssh to the node which HistoryServer, if any, is at. Shutdown the service. Double-check by `ps aux | grep java`, if the process still exists, execute `kill -9 PID` on it.
cd $HADOOP_HOME
$HADOOP_HOME/sbin/mr-jobhistory-daemon.sh stop historyserver

Shutdown YARN service.
cd $HADOOP_HOME
$HADOOP_HOME/sbin/stop-yarn.sh

Check whether NodeManager process has been stopped on every DataNode, if not, we have to `kill -9 PID` it.
for i in $(cat $HADOOP_HOME/etc/hadoop/slaves | grep -v "#")
do
 echo '';
 echo $i;
 ssh supertool@$i "/usr/java/jdk1.7.0_11/bin/jps ";
done

Restart YARN service and check again using the above shell script to make sure all NodeManager processes have been started.
cd $HADOOP_HOME
$HADOOP_HOME/sbin/start-yarn.sh

Restart HistoryServer, if any.
cd $HADOOP_HOME
$HADOOP_HOME/sbin/mr-jobhistory-daemon.sh start historyserver


© 2014-2017 jason4zhu.blogspot.com All Rights Reserved 
If transfering, please annotate the origin: Jason4Zhu

Friday, November 21, 2014

Some Mapper Tasks In Hadoop Hang For A Long Time With Epollwait Shown By Jstack


Phenomenon

When running our scheduled jobs at night, there will be some mapper task attempts hang without any progress for so long a time. According to Buckets Effect, the total time is determined by the shortest end. Thus, elapsed time of our job is dragged longer than it's supposed to be:


Footprint Of Solution

At first, we intend to ssh on that specific machine where the stuck mapper task attempt is running to check out what is going on, but ssh is stuck too. We check on ganglia,  the total consumption of CPU, network IO as well as memory is relatively low, which means that all of them is not the bottleneck of this problem.

After this machine recovers, we login on it and check out the message buffer of the kernel, a mountain of "TCP: too many of orphaned sockets" is printed on screen:
> su root
> dmesg
Out of socket memory
TCP: too many of orphaned sockets
...

In general, there are two possibilities which can cause "Out of socket memory", namely:
  1. The server is running out of TCP memory
  2. There are too many orphaned sockets on the system
For the first case, we can check the setting of TCP memory by:
cat /proc/sys/net/ipv4/tcp_mem
196608 262144 393216

tcp_mem is a vector of 3 integers: min, pressure and max.
  • min : below this number of pages TCP is not bothered about its memory consumption. 
  • pressure: when the amount of memory allocated to TCP by the kernel exceeds this threshold, the kernel starts to moderate the memory consumption. This mode is exited when memory consumption falls under min.
  • max : the max number of pages allowed for queuing by all TCP sockets. When the system goes above this threshold, the kernel will start throwing the "Out of socket memory" error in the logs.

For the second case, the setting of max_orphan is shown by:
cat /proc/sys/net/ipv4/tcp_max_orphans
300000

The way to check out current orphan amount and TCP memory use is as follows:
cat /proc/net/sockstat
sockets: used 755
TCP: inuse 103 orphan 0 tw 0 alloc 308 mem 221
UDP: inuse 10 mem 0
RAW: inuse 0
FRAG: inuse 0 memory 0

In order to monitor on the current orphan amount as well as TCP memory use, I write a script:
//--orphan.sh--
#!/bin/bash
while true
do
date >> /home/hadoop/orphan.out
cat /proc/net/sockstat >> /home/hadoop/orphan.out
echo "" >> /home/hadoop/orphan.out
sleep 5
done


//--orphan distribution shell--
for i in $(cat $HADOOP_HOME/etc/hadoop/slaves | grep -v "#")
do
echo $i
scp orphan.sh hadoop@$i:/home/hadoop/;
ssh hadoop@$i "nohup bash orphan.sh 2>&1 &" &
done

After some time, I count on all the collected log in every node to see how many times each condition is triggered. For the first case, no orphan amount is greater than max_orphan. For the second case, there are some nodes in our Hadoop cluster that always exceed the max of TCP memory frequently:
for i in $(cat etc/hadoop/slaves | grep -v '#'); do out_mem=$(ssh hadoop@$i "grep TCP orphan.out  | awk '{if(\$NF >  393216)print}'  |wc -l"); echo $i, $out_mem; done

Surprisingly, all the problem-related nodes are relatively new, and are forgotten to tuning on TCP configurations. The reference for tuning is from Tuning Hadoop on Dell PowerEdge Servers.

Related commands for `sysctl`:
// The file to configure custom paramters.
vim /etc/sysctl.conf

// Command to list all configurations in sysctl.
/sbin/sysctl -a

The sysctl.conf of tuned node:
fs.file-max = 800000
net.core.rmem_default = 12697600
net.core.wmem_default = 12697600
net.core.rmem_max = 873800000
net.core.wmem_max = 655360000
net.ipv4.tcp_rmem = 8192 262144 4096000
net.ipv4.tcp_wmem = 4096 262144 4096000
net.ipv4.tcp_mem = 196608 262144 3145728
net.ipv4.tcp_max_orphans = 300000
net.ipv4.tcp_tw_reuse = 1
net.ipv4.tcp_tw_recycle = 1
net.ipv4.ip_local_port_range = 1025 65535
net.ipv4.tcp_max_syn_backlog = 100000
net.ipv4.tcp_fin_timeout = 30
net.ipv4.tcp_keepalive_time = 1200
net.ipv4.tcp_max_tw_buckets = 5000
net.ipv4.netfilter.ip_conntrack_tcp_timeout_established = 1500
net.core.somaxconn=32768
vm.swappiness=0

The difference between tuned and non-tuned nodes is shown as below:
//—- tuned --
fs.file-max = 800000
net.core.rmem_default = 12697600
net.core.wmem_default = 12697600
net.core.rmem_max = 873800000
net.core.wmem_max = 655360000
net.ipv4.tcp_rmem = 8192 262144 4096000
net.ipv4.tcp_wmem = 4096 262144 4096000
net.ipv4.tcp_max_orphans = 300000
net.ipv4.tcp_tw_reuse = 1
net.ipv4.tcp_tw_recycle = 1
net.ipv4.tcp_max_tw_buckets = 5000
net.ipv4.ip_local_port_range = 1025 65535
net.ipv4.tcp_max_syn_backlog = 100000
net.ipv4.tcp_fin_timeout = 30
net.core.somaxconn=32768
vm.swappiness=0

//—- non-tuned --
fs.file-max = 400000
net.core.rmem_default = 12697600
net.core.wmem_default = 12697600
net.core.rmem_max = 873800000
net.core.wmem_max = 655360000
net.ipv4.tcp_rmem =  8192 8738000 873800000
net.ipv4.tcp_wmem = 4096 6553600 655360000
net.ipv4.tcp_max_orphans = 300000
net.ipv4.tcp_tw_reuse = 0
net.ipv4.tcp_tw_recycle = 0
net.ipv4.tcp_max_tw_buckets = 180000
net.ipv4.ip_local_port_range = 1025 65535
net.ipv4.tcp_max_syn_backlog = 100000
net.ipv4.tcp_fin_timeout = 2
net.core.somaxconn=128
vm.swappiness=60

After configuring all the non-tuned nodes exactly the same as tuned one and restart network via `/etc/init.d/network restart` (`/sbin/sysctl -p` can also reload the user-defined parameters set in /etc/sysctl.conf), error 'Out of socket memory' is gone.

But, hanging of mapper task attempts still exists. With more in-depth observation, mapper task attempts will progress smoothly if there are only one or two jobs running synchronously.

In this time, we could ssh to the specific node where the stuck mapper task attempt is running. Assuming the mapper task attempt is 'attempt_1413206225298_34853_m_000035_0', the following command can print out the stacktrace of this java process at that stuck state:
// Get the corresponding PID of this stuck mapper task attempt
/usr/java/jdk1.7.0_11/bin/jps -ml | grep attempt_1413206225298_34853_m_000035_0

// Print out current stack info
/usr/java/jdk1.7.0_11/bin/jstack 1570

"main" prio=10 tid=0x000000000a4e0000 nid=0x3abb runnable [0x000000004108c000]
   java.lang.Thread.State: RUNNABLE
        at sun.nio.ch.EPollArrayWrapper.epollWait(Native Method)
        at sun.nio.ch.EPollArrayWrapper.poll(EPollArrayWrapper.java:228)
        at sun.nio.ch.EPollSelectorImpl.doSelect(EPollSelectorImpl.java:81)
        at sun.nio.ch.SelectorImpl.lockAndDoSelect(SelectorImpl.java:87)
        - locked <0x00000007a674bb38> (a sun.nio.ch.Util$2)
        - locked <0x00000007a674bb28> (a java.util.Collections$UnmodifiableSet)
        - locked <0x00000007a66487d8> (a sun.nio.ch.EPollSelectorImpl)
        at sun.nio.ch.SelectorImpl.select(SelectorImpl.java:98)
        at org.apache.hadoop.net.SocketIOWithTimeout$SelectorPool.select(SocketIOWithTimeout.java:335)
        at org.apache.hadoop.net.SocketIOWithTimeout.doIO(SocketIOWithTimeout.java:157)
        at org.apache.hadoop.net.SocketInputStream.read(SocketInputStream.java:161)
        at org.apache.hadoop.hdfs.protocol.datatransfer.PacketReceiver.readChannelFully(PacketReceiver.java:258)
        at org.apache.hadoop.hdfs.protocol.datatransfer.PacketReceiver.doReadFully(PacketReceiver.java:209)
        at org.apache.hadoop.hdfs.protocol.datatransfer.PacketReceiver.doRead(PacketReceiver.java:171)
        at org.apache.hadoop.hdfs.protocol.datatransfer.PacketReceiver.receiveNextPacket(PacketReceiver.java:102)
        at org.apache.hadoop.hdfs.RemoteBlockReader2.readNextPacket(RemoteBlockReader2.java:170)
        at org.apache.hadoop.hdfs.RemoteBlockReader2.read(RemoteBlockReader2.java:135)
        - locked <0x00000007b2d99ee0> (a org.apache.hadoop.hdfs.RemoteBlockReader2)
        at org.apache.hadoop.hdfs.DFSInputStream$ByteArrayStrategy.doRead(DFSInputStream.java:642)
        at org.apache.hadoop.hdfs.DFSInputStream.readBuffer(DFSInputStream.java:698)
        - eliminated <0x00000007b2d91d68> (a org.apache.hadoop.hdfs.DFSInputStream)
        at org.apache.hadoop.hdfs.DFSInputStream.readWithStrategy(DFSInputStream.java:752)
        at org.apache.hadoop.hdfs.DFSInputStream.read(DFSInputStream.java:793)
        - locked <0x00000007b2d91d68> (a org.apache.hadoop.hdfs.DFSInputStream)
        at java.io.DataInputStream.read(DataInputStream.java:149)
        at com.miaozhen.app.MzSequenceFile$PartInputStream.read(MzSequenceFile.java:453)
        at org.apache.hadoop.io.compress.BlockDecompressorStream.getCompressedData(BlockDecompressorStream.java:127)
        at org.apache.hadoop.io.compress.BlockDecompressorStream.decompress(BlockDecompressorStream.java:98)
        at org.apache.hadoop.io.compress.DecompressorStream.read(DecompressorStream.java:85)
        at java.io.DataInputStream.readFully(DataInputStream.java:195)
        at org.apache.hadoop.io.Text.readFields(Text.java:292)
        at org.apache.hadoop.io.serializer.WritableSerialization$WritableDeserializer.deserialize(WritableSerialization.java:71)
        at org.apache.hadoop.io.serializer.WritableSerialization$WritableDeserializer.deserialize(WritableSerialization.java:42)
        at com.miaozhen.app.MzSequenceFile$Reader.deserializeValue(MzSequenceFile.java:677)
        at com.miaozhen.app.MzSequenceFile$Reader.next(MzSequenceFile.java:694)
        at com.miaozhen.app.MzSequenceFile$Reader.next(MzSequenceFile.java:704)
        at com.miaozhen.yo.dicmanager.panel.NewPanel.getNextRow(NewPanel.java:379)
        at com.miaozhen.yo.dicmanager.panel.NewPanel.locate(NewPanel.java:414)
        at com.miaozhen.yo.tcpreporter.Stat.getPanel(Stat.java:66)
        at com.miaozhen.yo.tcpreporter.Stat.update(Stat.java:99)
        at com.miaozhen.yo.phase1.Phase1Mapper.updateHistory(Phase1Mapper.java:75)
        at com.miaozhen.yo.phase1.Phase1Mapper.map(Phase1Mapper.java:56)
        at com.miaozhen.yo.phase1.Phase1Mapper.map(Phase1Mapper.java:31)
        at org.apache.hadoop.mapred.MapRunner.run(MapRunner.java:54)
        at org.apache.hadoop.mapred.MapTask.runOldMapper(MapTask.java:429)
        at org.apache.hadoop.mapred.MapTask.run(MapTask.java:341)
        at org.apache.hadoop.mapred.YarnChild$2.run(YarnChild.java:162)
        at java.security.AccessController.doPrivileged(Native Method)
        at javax.security.auth.Subject.doAs(Subject.java:415)
        at org.apache.hadoop.security.UserGroupInformation.doAs(UserGroupInformation.java:1491)
        at org.apache.hadoop.mapred.YarnChild.main(YarnChild.java:157)

From the stacktrace, we could see the process is stuck at epollWait, which is in NIO.

It is likely that there are some sort of max connection amount for a file in HDFS. Since there are some global files in HDFS which will be read by all mapper task attempts for all jobs. In the above stacktrace, we could see that the global files mentioned above is the 'Panel' files. Thus we change the replication of these 'Panel' files from 3 to 31:
hadoop dfs -setrep -R -w 31 /tong/data/resource
hadoop dfs -ls -R /tong/data/resource


In this time, the mapper doesn't hang anymore.

In conclusion, when there are some mappers hang (To generalize, when a java thread is stuck), we should check out CPU, network IO, as well as memory use at first. If nothing goes awry, we then could apply `jstack` on this process to check out the stuck point and find the problem.


References:
  1. troubleshooting-out-of-socket-memory
  2. linux-tcp-tuning
  3. sysctl(8)
  4. configtuning-sysctl
  5. sysctl-conf


© 2014-2017 jason4zhu.blogspot.com All Rights Reserved 
If transfering, please annotate the origin: Jason4Zhu

Tuesday, November 18, 2014

The Script Template For Checking On And Synchronizing Configuration Files To All Nodes In Hadoop

Here's the skeleton of shell script template:
for  i  in  $(cat  $HADOOP_HOME/etc/hadoop/slaves  |  grep  -v  "#")
do
  #......
done

It takes advantages of slaves file, in which all DataNodes are listed. In addition, we should append all the other nodes, say NameNode, in Hadoop exhaustively.

There are two scenarios that I commonly use the above shell in:

#1. Synchronizing Configuration Files

for i in $(cat $HADOOP_HOME/etc/hadoop/slaves | grep -v "#")
do
 echo '';
 echo $i;
 rsync -r --delete $HADOOP_HOME/etc/hadoop/ hadoop@$i:/home/supertool/hadoop-2.2.0/etc/hadoop/;
done

#2. Checking On Specific Processes

Every so often, we have to check out whether some specific processes have started or been killed on all related nodes after we executing commands like `start-yarn.sh`, `hadoop-daemon.sh start datanode`, `yarn-daemon.sh stop nodemanager`, etc. It would be time-saver if the script is applied.
for i in $(cat etc/hadoop/slaves | grep -v "#")
do
  echo ''
  echo $i
  ssh supertool@$i "/usr/java/jdk1.7.0_11/bin/jps | grep -i NodeManager"
done


© 2014-2017 jason4zhu.blogspot.com All Rights Reserved 
If transfering, please annotate the origin: Jason4Zhu

The Way To Set Global Java Opts In Hadoop Without Being Overlapped At Runtime

I intend to set the default java GC collector to '-XX:+UseSerialGC' for all YARN applications without being overlapped at runtime.

After setting it to parameter 'mapreduce.map.java.opts' in mapred-site.xml as below and synchronizing it to all nodes, it will be overlapped when configuring the same parameter at runtime, for instance: `hadoop jar share/hadoop/mapreduce/hadoop-mapreduce-examples-2.2.0.jar pi -Dmapreduce.map.java.opts="-Xmx256M" 4 1000`.
//mapred-site.xml
<property>
    <name>mapreduce.map.java.opts</name>
    <value>-Xmx1024M  -XX:+UseSerialGC</value>
</property>

There are two commands we can issue on a DataNode to check out whether the parameter '-XX:+UseSerialGC' takes into effect or not. Whichever command we are using, we should only focus on 'YarnChild' processes.
//--#1--
/usr/java/jdk1.7.0_11/bin/jps  -mlv  |  grep  -i  gc  
//--#2--
/usr/java/jdk1.7.0_11/bin/jps  |  awk  '{if($2=="YarnChild")  print  $1}'  |  xargs  /usr/java/jdk1.7.0_11/bin/jinfo  |  grep  -i  gc'

Then I tried to configure it in hadoop-env.sh, neither 'HADOOP_OPTS' nor 'HADOOP_CLIENT_OPTS' did it work:
//hadoop-env.sh
export  HADOOP_OPTS="$HADOOP_OPTS  -Dmapreduce.map.java.opts='-XX:+UseSerialGC'"
export  HADOOP_CLIENT_OPTS="-XX:+UseSerialGC  $HADOOP_CLIENT_OPTS"

Finally, I found a parameter which is not described in the official document of mapred-default.xml: 'mapreduce.admin.map.child.java.opts' (The corresponding one to reduce is 'mapreduce.admin.reduce.child.java.opts'). After setting this parameter in mapred-site.xml and synchronizing the file to all nodes, it works fine and definitely will not be overrided since we merely override parameter 'mapreduce.map.java.opts' at runtime.
//mapred-site.xml
<property>
    <name>mapreduce.admin.map.child.java.opts</name>
    <value>-XX:+UseSerialGC</value>
</property>

Consequencely, when we'are going to set some global java opts, we can set them in 'mapreduce.admin.map.child.java.opts' and 'mapreduce.admin.reduce.child.java.opts' in mapred-site.xml.


References:
  1. Chapter 3. Setting Up the Hadoop Configuration - Hortonworks Data Platform


© 2014-2017 jason4zhu.blogspot.com All Rights Reserved 
If transfering, please annotate the origin: Jason4Zhu

Wednesday, November 12, 2014

The Correct Way To Write Main Method In MapReduce Project In Order To Add Runtime Arguments.

The command to run a MapReduce task from command line is as follows:
//command
hadoop  jar  *.jar  main_class  [argu..]

//example
hadoop  jar  $HADOOP_HOME/share/hadoop/mapreduce/hadoop-mapreduce-examples-2.2.0.jar  pi  -Dmapred.job.queue.name=root.example_queue  10  10000

As we can see, '-Dmapred.job.queue.name=root.example_queue', '10' and '10000' are all arguments from the view of java class, thus they will be passed to 'args[]' argument of the main class.

But we intend to make all the '-D'-prefix argument as runtime hadoop parameters, the following way of writing MapReduce task entry is not working, because argument ''-Dmapred.job.queue.name=root.example_queue'' will be taken as args[0] in the example of above:
public  static  void  main(String[]  args)  throws  Exception  {
        JobConf  conf  =  new  JobConf(WordCount.class);
        conf.setJobName("wordcount");

        conf.setOutputKeyClass(Text.class);
        conf.setOutputValueClass(IntWritable.class);

        conf.setMapperClass(Map.class);
        conf.setCombinerClass(Reduce.class);
        conf.setReducerClass(Reduce.class);

        conf.setInputFormat(TextInputFormat.class);
        conf.setOutputFormat(TextOutputFormat.class);

        FileInputFormat.setInputPaths(conf,  new  Path(args[0]));
        FileOutputFormat.setOutputPath(conf,  new  Path(args[1]));

        JobClient.runJob(conf);
    }

The correct way is to use 'GenericOptionsParser', which will auto-load '-D'-prefix arguments into runtime MapReduce configuration and separate out all the user-defined arguments:
public  static  void  main(  String[]  args  )  throws  Exception  {
        Configuration  conf  =  new  Configuration();
        String[]  otherArgs  =  new  GenericOptionsParser(conf,  args).getRemainingArgs();
        if  (otherArgs.length  !=  3)  {
            System.err.println(  "Usage:  wordcount  <in>  <out>  <useless_interval>");
            System.exit(2);
        }
        Job  job  =  new  Job(conf,  "wordcount");
        job.setJarByClass(WordCount.class);
        job.setMapperClass(Map.class);
        job.setReducerClass(Reduce.class);
        job.setOutputKeyClass(Text.class);
        job.setOutputValueClass(IntWritable.class);
        FileInputFormat.addInputPath(job,  new  Path(otherArgs  [0]));
        FileOutputFormat.setOutputPath(job,  new  Path(otherArgs  [1]));
      
        System.exit(job.waitForCompletion(true)  ?  0  :  1);
}


© 2014-2017 jason4zhu.blogspot.com All Rights Reserved 
If transfering, please annotate the origin: Jason4Zhu

Yarn Log Aggregation Configuration In Hadoop

Log-Aggregation is a centralized management of logs in all NodeManager nodes provided by YARN. It will aggregate and upload finished container or task's log to HDFS. The related configurations are as follows:
name value description
yarn.log-aggregation-enable false Whether to enable log aggregation
yarn.log-aggregation.retain-seconds -1 How long to keep aggregation logs before deleting them. -1 disables. Be careful set this too small and you will spam the name node.
yarn.log-aggregation.retain-check-interval-seconds -1 How long to wait between aggregated log retention checks. If set to 0 or a negative value then the value is computed as one-tenth of the aggregated log retention time. Be careful set this too small and you will spam the name node.
yarn.nodemanager.remote-app-log-dir /tmp/logs Where to aggregate logs to.
yarn.nodemanager.remote-app-log-dir-suffix logs The remote log dir will be created at {yarn.nodemanager.remote-app-log-dir}/${user}/{thisParam}

Logs from NodeManager can be seen from the YARN monitor webpage:


References:
  1. Hadoop-Yarn-Configurations: Log-Aggregation - Dong


© 2014-2017 jason4zhu.blogspot.com All Rights Reserved 
If transfering, please annotate the origin: Jason4Zhu

Dig Into JobHistory Server Of MapReduce In Hadoop2

JobHistory Server is a standalone module in hadoop2, and will be started or stopped separately apart from start-all.sh and stop-all.sh. It serves as the job history logger, which will log down all the info in configured filesystem from the birth of a MapReduce task to its death.

JobHistory logs can be found from the page shown below:

Configuration & Command

There are two arguments related to the startup and monitor-page of jobhistory:
<property>
    <name>mapreduce.jobhistory.address</name>
    <value>host:10020</value>
</property>
<property>
    <name>mapreduce.jobhistory.webapp.address</name>
    <value>host:19888</value>
</property>

And another three arguments related to the storaging path of job history files:
name value description
yarn.app.mapreduce.am.staging-dir /tmp/hadoop-yarn/staging The staging dir used while submitting jobs.
mapreduce.jobhistory.intermediate-done-dir ${yarn.app.mapreduce.am.staging-dir}/history/done_intermediate
mapreduce.jobhistory.done-dir ${yarn.app.mapreduce.am.staging-dir}/history/done
We'd better `mkdir` and `chmod` of the above three directories ourselves.
hadoop  fs  -mkdir  -p  /tmp/hadoop-yarn/staging/history/done_intermediate
hadoop  fs  -chmod  -R  777  /tmp/hadoop-yarn/staging/history/done_intermediate
hadoop  fs  -mkdir  -p  /tmp/hadoop-yarn/staging/history/done
hadoop  fs  -chmod  -R  777  /tmp/hadoop-yarn/staging/history/done

The command to start and stop JobHistory Server is quite easy:
${HADOOP_HOME}/sbin/mr-jobhistory-daemon.sh  start historyserver
${HADOOP_HOME}/sbin/mr-jobhistory-daemon.sh  stop  historyserver

Procedure of Logging in History Server

When a MapReduce application starts, history server will write logs in ${yarn.app.mapreduce.am.staging-dir}/${current_user}/.staging/job_XXXXX_XXX, in which there are three files: .jhist, .summary and .xml, representing job history, job summary and configuration file, respectively.

When this application is finished/killed/failed, the log info will be copied to ${mapreduce.jobhistory.intermediate-done-dir}/${current_user}. This procedure is implemented at "org.apache.hadoop.mapreduce.jobhistory.JobHistoryEventHandler".

After copied to ${mapreduce.jobhistory.intermediate-done-dir}/${current_user},  The job history file will eventually be moved to ${mapreduce.jobhistory.done-dir} by "org.apache.hadoop.mapreduce.v2.hs.HistoryFileManager".

All logs for this procedure will be recorded to ${HADOOP_HOME}/logs/userlogs, which is configured by argument 'yarn.nodemanager.log-dirs', in each NodeManager node provided yarn-log-aggregation is not enabled.

NullPointerException With History Server

We're facing a problem that some of our MapReduce tasks, especially for long time-consuming tasks, will throw NullPointerException when the job completes, the stacktrace is as follows:
14/07/22 06:37:11 INFO mapreduce.Job:  map 100% reduce 98%
14/07/22 06:37:44 INFO mapreduce.Job:  map 100% reduce 99%
14/07/22 06:38:30 INFO mapreduce.Job:  map 100% reduce 100%
14/07/22 06:39:02 INFO mapred.ClientServiceDelegate: Application state is
completed. FinalApplicationStatus=SUCCEEDED. Redirecting to job history
server
14/07/22 06:39:02 INFO mapred.ClientServiceDelegate: Application state is
completed. FinalApplicationStatus=SUCCEEDED. Redirecting to job history
server
14/07/22 06:39:02 INFO mapred.ClientServiceDelegate: Application state is
completed. FinalApplicationStatus=SUCCEEDED. Redirecting to job history
server
14/07/22 06:39:02 ERROR security.UserGroupInformation:
PriviledgedActionException as: rohitsarewar (auth:SIMPLE)
cause:java.io.IOException:
org.apache.hadoop.ipc.RemoteException(java.lang.NullPointerException):
java.lang.NullPointerException
        at
org.apache.hadoop.mapreduce.v2.hs.HistoryClientService$HSClientProtocolHandler.getTaskAttemptCompletionEvents(HistoryClientService.java:269)
        at
org.apache.hadoop.mapreduce.v2.api.impl.pb.service.MRClientProtocolPBServiceImpl.getTaskAttemptCompletionEvents(MRClientProtocolPBServiceImpl.java:173)
        at
org.apache.hadoop.yarn.proto.MRClientProtocol$MRClientProtocolService$2.callBlockingMethod(MRClientProtocol.java:283)
        at
org.apache.hadoop.ipc.ProtobufRpcEngine$Server$ProtoBufRpcInvoker.call(ProtobufRpcEngine.java:585)
        at org.apache.hadoop.ipc.RPC$Server.call(RPC.java:928)
        at org.apache.hadoop.ipc.Server$Handler$1.run(Server.java:2053)
        at org.apache.hadoop.ipc.Server$Handler$1.run(Server.java:2049)
        at java.security.AccessController.doPrivileged(Native Method)
        at javax.security.auth.Subject.doAs(Subject.java:396)
        at
org.apache.hadoop.security.UserGroupInformation.doAs(UserGroupInformation.java:1491)
        at org.apache.hadoop.ipc.Server$Handler.run(Server.java:2047)
Exception in thread "main" java.io.IOException:
org.apache.hadoop.ipc.RemoteException(java.lang.NullPointerException):
java.lang.NullPointerException
        at
org.apache.hadoop.mapreduce.v2.hs.HistoryClientService$HSClientProtocolHandler.getTaskAttemptCompletionEvents(HistoryClientService.java:269)
        at
org.apache.hadoop.mapreduce.v2.api.impl.pb.service.MRClientProtocolPBServiceImpl.getTaskAttemptCompletionEvents(MRClientProtocolPBServiceImpl.java:173)
        at
org.apache.hadoop.yarn.proto.MRClientProtocol$MRClientProtocolService$2.callBlockingMethod(MRClientProtocol.java:283)
        at
org.apache.hadoop.ipc.ProtobufRpcEngine$Server$ProtoBufRpcInvoker.call(ProtobufRpcEngine.java:585)
        at org.apache.hadoop.ipc.RPC$Server.call(RPC.java:928)
        at org.apache.hadoop.ipc.Server$Handler$1.run(Server.java:2053)
        at org.apache.hadoop.ipc.Server$Handler$1.run(Server.java:2049)
        at java.security.AccessController.doPrivileged(Native Method)
        at javax.security.auth.Subject.doAs(Subject.java:396)
        at
org.apache.hadoop.security.UserGroupInformation.doAs(UserGroupInformation.java:1491)
        at org.apache.hadoop.ipc.Server$Handler.run(Server.java:2047)
        at
org.apache.hadoop.mapred.ClientServiceDelegate.invoke(ClientServiceDelegate.java:330)
        at
org.apache.hadoop.mapred.ClientServiceDelegate.getTaskCompletionEvents(ClientServiceDelegate.java:382)
        at
org.apache.hadoop.mapred.YARNRunner.getTaskCompletionEvents(YARNRunner.java:529)
        at org.apache.hadoop.mapreduce.Job$5.run(Job.java:668)
        at org.apache.hadoop.mapreduce.Job$5.run(Job.java:665)
        at java.security.AccessController.doPrivileged(Native Method)
        at javax.security.auth.Subject.doAs(Subject.java:415)
        at
org.apache.hadoop.security.UserGroupInformation.doAs(UserGroupInformation.java:1491)
        at
org.apache.hadoop.mapreduce.Job.getTaskCompletionEvents(Job.java:665)
        at org.apache.hadoop.mapreduce.Job.monitorAndPrintJob(Job.java:1349)
        at org.apache.hadoop.mapreduce.Job.waitForCompletion(Job.java:1289)
        at com.bigdata.mapreduce.esc.escDriver.main(escDriver.java:23)
        at sun.reflect.NativeMethodAccessorImpl.invoke0(Native Method)
        at
sun.reflect.NativeMethodAccessorImpl.invoke(NativeMethodAccessorImpl.java:57)
        at
sun.reflect.DelegatingMethodAccessorImpl.invoke(DelegatingMethodAccessorImpl.java:43)
        at java.lang.reflect.Method.invoke(Method.java:606)
        at org.apache.hadoop.util.RunJar.main(RunJar.java:212)
Caused by:
org.apache.hadoop.ipc.RemoteException(java.lang.NullPointerException): j
        at
org.apache.hadoop.mapreduce.v2.hs.HistoryClientService$HSClientProtocolH
        at
org.apache.hadoop.mapreduce.v2.api.impl.pb.service.MRClientProtocolPBSer
        at
org.apache.hadoop.yarn.proto.MRClientProtocol$MRClientProtocolService$2.
        at
org.apache.hadoop.ipc.ProtobufRpcEngine$Server$ProtoBufRpcInvoker.call(P
        at org.apache.hadoop.ipc.RPC$Server.call(RPC.java:928)
        at org.apache.hadoop.ipc.Server$Handler$1.run(Server.java:2053)
        at org.apache.hadoop.ipc.Server$Handler$1.run(Server.java:2049)
        at java.security.AccessController.doPrivileged(Native Method)
        at javax.security.auth.Subject.doAs(Subject.java:396)
        at
org.apache.hadoop.security.UserGroupInformation.doAs(UserGroupInformatio
        at org.apache.hadoop.ipc.Server$Handler.run(Server.java:2047)
        at org.apache.hadoop.ipc.Client.call(Client.java:1347)
        at org.apache.hadoop.ipc.Client.call(Client.java:1300)
        at
org.apache.hadoop.ipc.ProtobufRpcEngine$Invoker.invoke(ProtobufRpcEngine
        at com.sun.proxy.$Proxy12.getTaskAttemptCompletionEvents(Unknown
Source)
        at
org.apache.hadoop.mapreduce.v2.api.impl.pb.client.MRClientProtocolPBClie
        at sun.reflect.GeneratedMethodAccessor4.invoke(Unknown Source)
        at
sun.reflect.DelegatingMethodAccessorImpl.invoke(DelegatingMethodAccessor
        at java.lang.reflect.Method.invoke(Method.java:606)
        at
org.apache.hadoop.mapred.ClientServiceDelegate.invoke(ClientServiceDeleg
        ... 16 more

It seems like the remote history server object can not be found after the MapReduce job is done and try to invoke method on that object via IPC. Finally, we solve this problem by changing argument 'dfs.client.socket-timeout' for JobHistory service to '3600000', which is 1 hour. Because of high pressure on our HDFS cluster, there will be some delay or hanging when sending request to HDFS, thus we have to set this argument separately for JobHistory service. 

Notice that argument 'dfs.client.socket-timeout' in hdfs-site.xml for start/stop-dfs.sh should be relatively lower than '3600000', say '60000' or '180000'. Since a map has to wait exactly that much time in order to try again provided it fails in this time. 

Thus the procedure should be:
  1. Set 'dfs.client.socket-timeout' in hdfs-site.xml to 3600000.
  2. start JobHistory server.
  3. Set 'dfs.client.socket-timeout' in hdfs-site.xml back to 180000.
  4. start-dfs.sh
If this shared configuration file is too obscure and ill-managed, we could specify the config file for job historyserver when starting it up via:
./mr-jobhistory-daemon.sh --config /home/supertool/hadoop-2.2.0/etc/job_history_server_config/  start historyserver


References:

  1. Hadoop2 Jobhistory Log - Dong
  2. Start MapReduce JobHistory Server


© 2014-2017 jason4zhu.blogspot.com All Rights Reserved 
If transfering, please annotate the origin: Jason4Zhu